If you are like most shop owners or webmasters you have run the Google PageSpeed tool against your site. Sometimes the results are great, other times they are pretty dismal. Still developers are trying to appease the tool to get higher scores. In reality the scores that PageSpeed puts out are a bad metric to judge the speed of your site with. Let me show you why.
Breakdown of a PageSpeed score
The PageSpeed score is broken into two sections. The top section is what optimizations your site needs, and the bottom is the optimizations that have been found on your site already. Seems pretty straightforward doesn’t it?
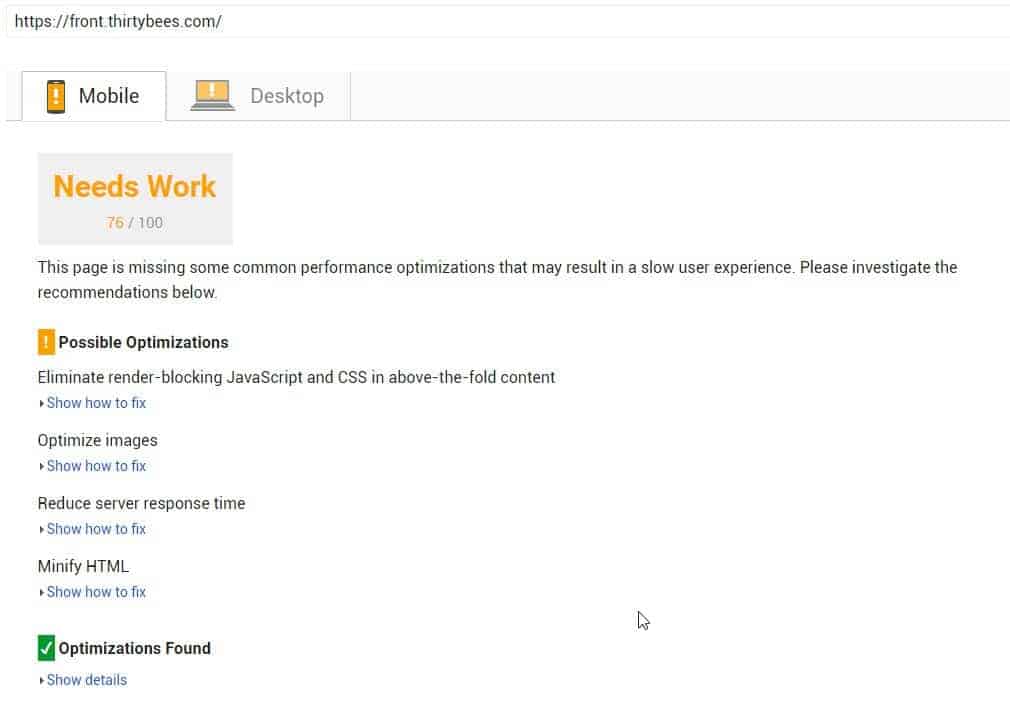
Looking at that score, it looks like things need work. You can see there is render blocking Javascript and CSS, the server response time does not seem to be that good, it gets flagged for it, the images could use some optimization, and the HTML needs to be minimized. Not a terribly bad score, but not that great of a score either.
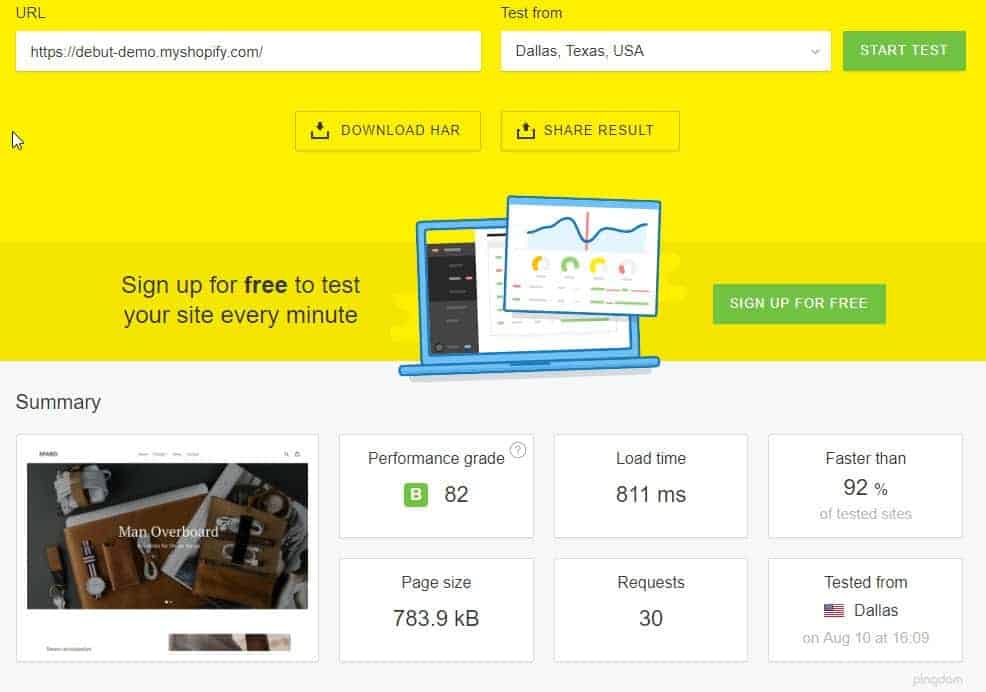
Now let us look at a Shopify theme and see how it scores. The image below is the scoring for the Shopify theme Debut.
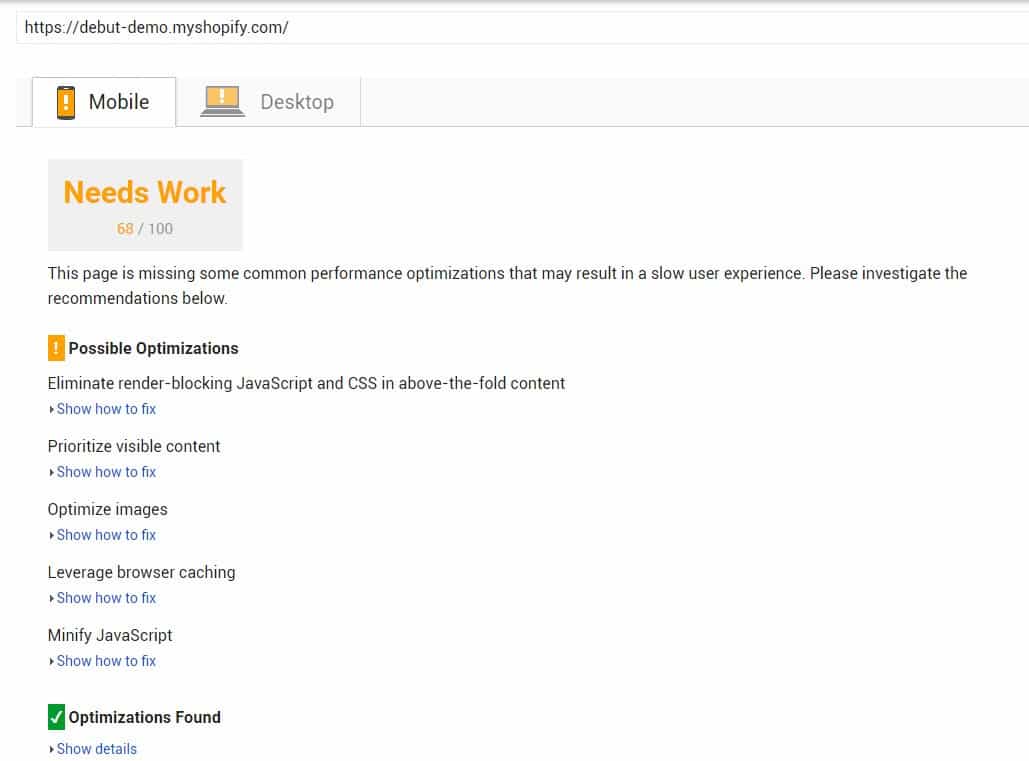
You can see with the Shopify demo it finds the same flaws as it did with ours, but they are a little worse which lowers the score. Well, there is one difference actually, the prioritization of visual content has been added in their test, and the reducing server response time has been removed.
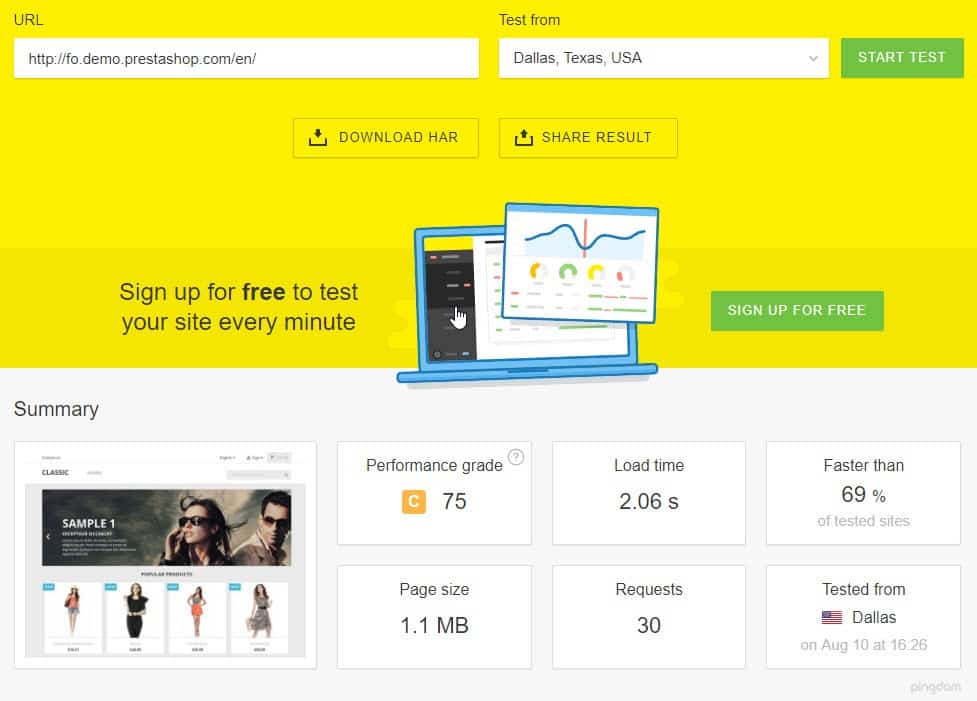
With thirty bees and Shopify down, let us have a look at how the new PrestaShop 1.7 theme fares on the page speed test.
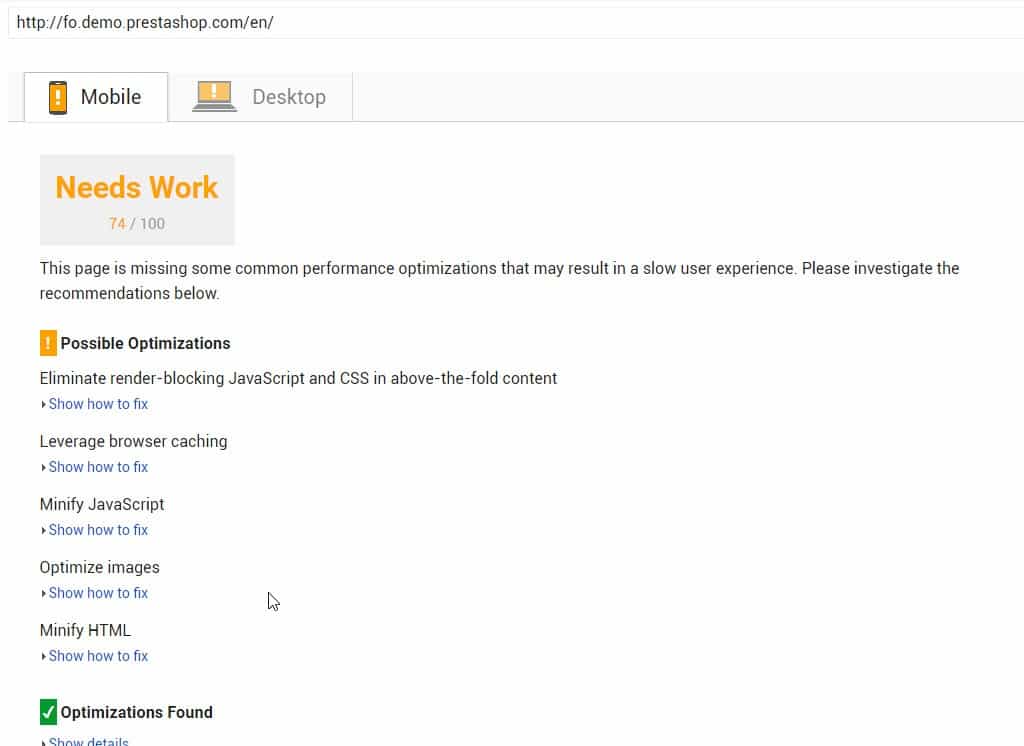
PrestaShop 1.7 fares about the same as thirty bees does on the PageSpeed test, only a couple of points lower than thirty bees. The test still picks up many of the same things that the other two tests do as well.
So who wins?
No one wins this test. The PageSpeed test uses methods that are not based around meaningful metrics to users or site owners. Looking at the tests in further detail you can start to see. All of the three sites were hit because of the render blocking CSS and Javascript. What does that mean exactly though?
The idea behind the render blocking CSS and Javascript is pretty simple. CSS stands for cascading style sheets, it loads in a cascading downward manner. So say you have a menu height set on line 100 of a style sheet and then on line 900 you set the height to something else. The browser will first load the menu at the height set on line 100, then it will update the height to what is set on line 900. This is called a repaint. Render blocking CSS in Google PageSpeed actually does not take this into account. What it takes into account is the size of the CSS files, not how optimized the CSS files themselves are. The initial view of the site could be loaded in the first 100 lines of the CSS file, and paint almost instantly, but PageSpeed would still ding your score if the file was too big.
At the same time, image optimization was dinged on all sites as well. What does that mean though? Is it really viable to site performance? I think on some levels it can be, but on others it is just a meaningless metric. The Shopify demo site shows that the images can be compressed to lose 66kb of data. Do we know if the compression metric they are using accounts for artifacting? You could very well reduce the sizes of the images by having a poorer image quality. This is not a good practice for anyone though. Also, what is 66kb of data? I had to actually break out a calculator for this one, but to download 66kb of data using a 10mbs connection will take you .05 seconds. If the Shopify theme had better image optimization it would speed the site download up by 1/20th of a second. For the effort that optimization does not seem worth it to me, but it reflects heavily in the score.
Some of the other dings the tests picked up were to minify the HTML and the Javascript. These, like the images, will help a site load literally fractions of second better. Going back to the Shopify theme, the PageSpeed test picked up 6kb of compression that could be saved on the Javascript files. This would result in a 1/200th of a second speed increase for the site. Not ideal for the amount of work it might entail.
Poor metrics like these is why PageSpeed is a doomed metric that is soon being replaced. It was a good idea at one time to help developers by nudging them into the best practices, but now the results that are flagged on most sites are antiquated.
More meaningful metrics
There are more meaningful metrics out, and it looks like Google themselves are pushing for them. Since the PageSpeed metric is only high level metric that has a tendency to be wrong, its no wonder that Google has already started phasing it out in favor of metrics that can better help developers create faster loading websites.
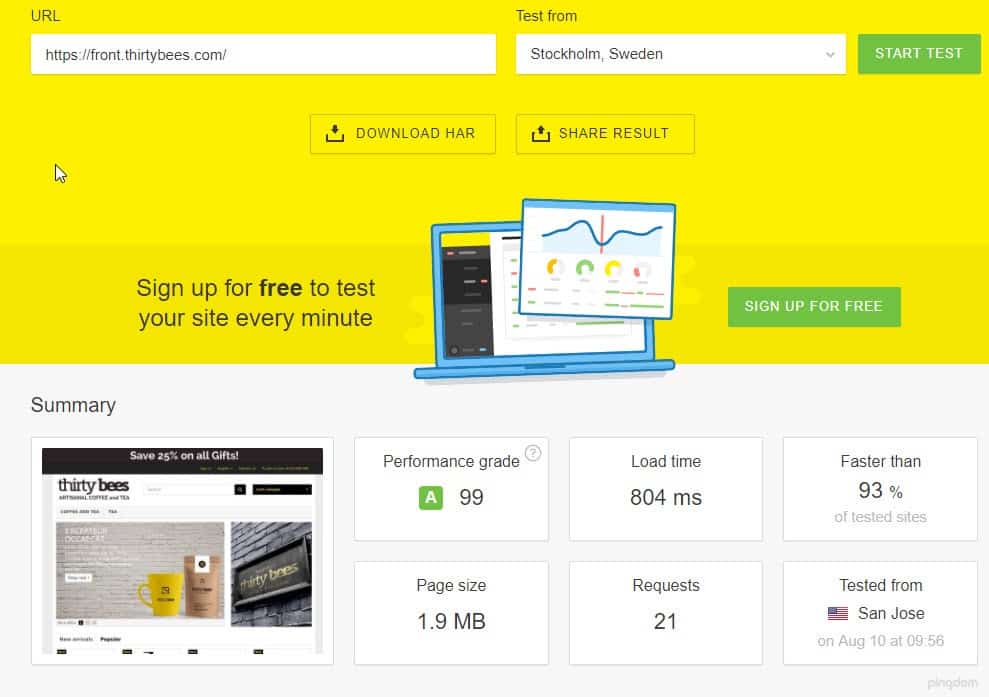
If you are not familiar with it, there is a tool called Lighthouse. It is a Google sponsored project, you can read more about it here. Lighthouse gives a view of performance that Google PageSpeed could never give. It does not rely on metrics of arbitrary values, it relies on the one metric that your users notice. How long does it take to load a page. With Google PageSpeed it is possible to have a page that takes 5 seconds to load and to score a 90. It is also possible to have a site that loads in .8 seconds and scores in the 60’s. With our tests earlier, here is a Pingdom time score of each site.
thirty bees
Shopify
Prestashop
Looking at the pure load time scores above thirty bees wins. Shopify gets second place, and PrestaShop third place. But remember the PageSpeed score? PrestaShop beat Shopify by 6 points in that score. If you were a site owner would you want a 6 points better score or a site that loaded 1.2 seconds faster than your competition? I think most site owners given the choice would not care about the score and would like the faster site. This is something that Pingdom can show you, but it also exposes a weakness in Pingdom as well.
The timing from Pingdom is the just the time it takes to download all files associated with your site. Nothing more, just the straight download time. It does not mean the metric is not useful, because it is, but it is not perfect. One huge factor that Pingdom misses in the equation is rendering. When is your site rendered where people can use it? does it matter if something at the footer takes 5 seconds to load, if the browsing user never realizes it?
Lighthouse
This is exactly what Lighthouse takes into account. How long it takes a mobile user to be able to use your site. Since mobile traffic is over 50% of the web traffic and most mobile optimization practices work for desktop as well, this is the best approach. It is what I would call a real world approach to the speed of sites. It measures exactly what matters to your users, how long it takes your site to load on their device.
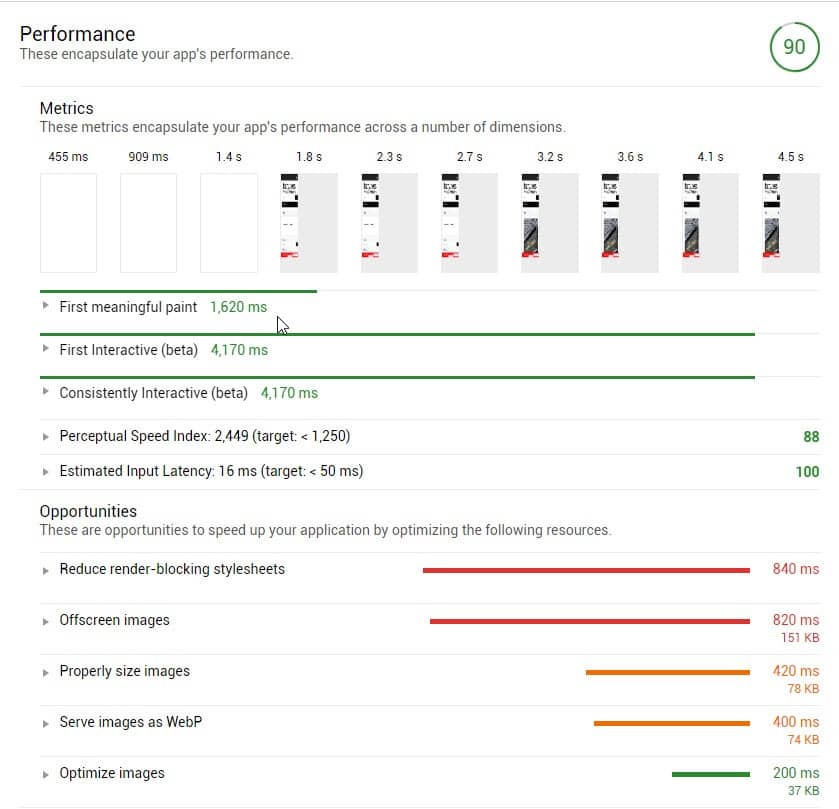
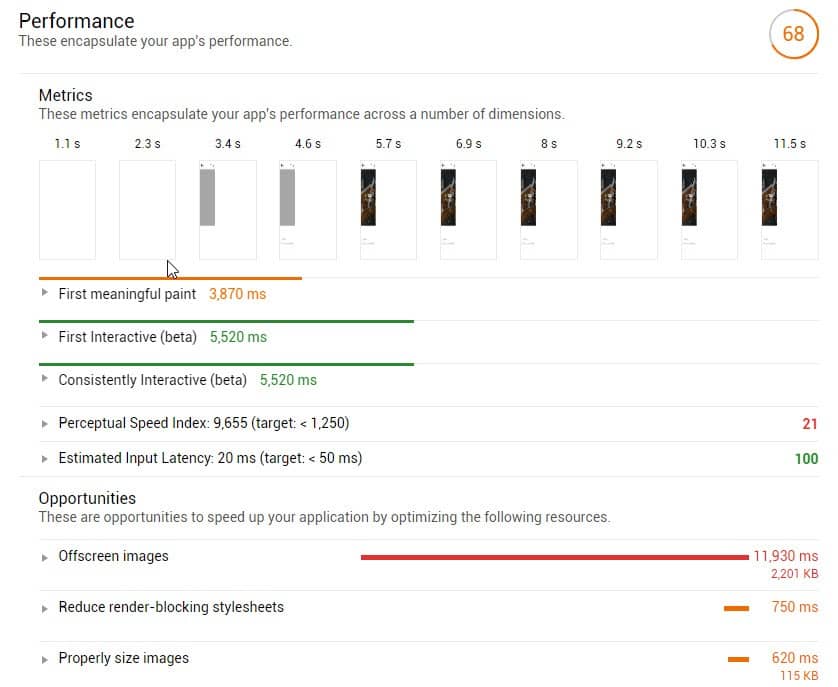
Let’s look at the three demo site’s results that have been run through the Lighthouse test, the testing metrics and the results are very different than the other two tests we have looked at. Also, one thing to note about the Lighthouse metric is they test things such as your site being a progressive web application, accessibility for disabled people, and for best practices in terms of development. Below are the three demo sites run through Lighthouse.
thirty bees

Shopify

PrestaShop

These results are very different from the results that either of the two previous tests had. One thing I will say, about the metrics, with these three demo sites, the Progressive Web App test does not matter. None of the sites are progressive applications. The main test we are focusing on is the performance test. But why are they so different from the other tests? thirty bees and Shopify loaded in close to the same amount of time, yet there is a big difference in the testing results. If we scroll down on the test to the performance section we can see a bit better. Below are the breakdowns of the three tests.
thirty bees
Shopify
PrestaShop
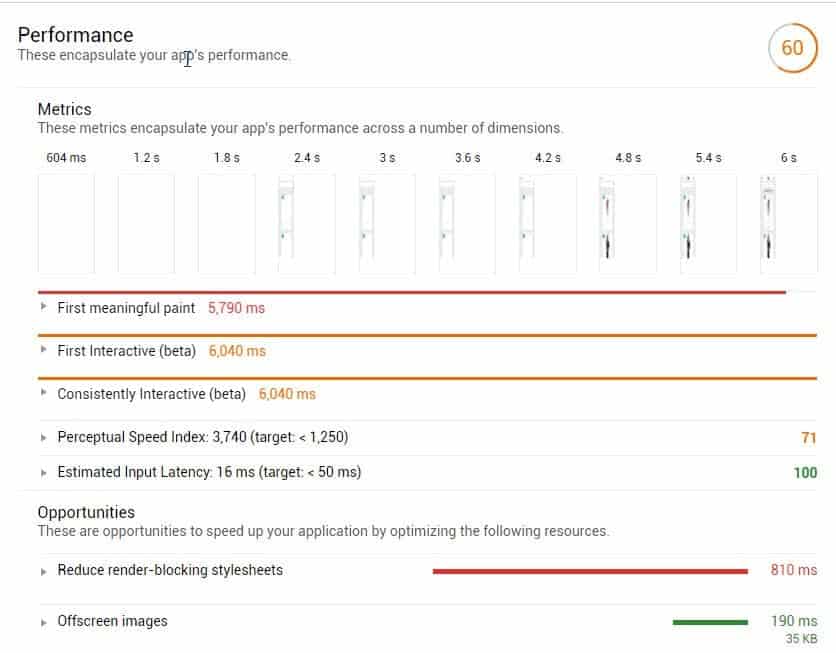
Looking at the break down of the three tests we can see where the emphasis is placed. The tests are testing the rendering time of the pages. This is what users notice. They do not notice the cache life you have for a font, they do not notice that you can optimize an image and reduce 6kb of data. They notice how long your web page takes to render on their device. And if it takes too long, they leave. It is actually pretty cut and dry.
Examining these tests actually provide somewhat of surprising results. Prestashop beat Shopify in the PageSpeed test by 6 points. But looking at the Lighthouse tests we can see that it takes over 2 seconds longer than Shopify to render the first meaningful paint. As a side note, a meaningful paint is the rendering of the page and all the elements on it, where a user can tell what your page structure is and start looking for information on the page. The first meaningful paint is the key metric. That is why we have tuned thirty bees around having a low paint time. This reduces the bounce rate, while at the same time it leaves users with a feeling of responsiveness and snappiness while on your website. What would you rather have? A better PageSpeed score, or would you rather have a site like the thirty bees demo that is fully rendered and ready for input before the PrestaShop site has even rendered in the browser?
Using Lighthouse
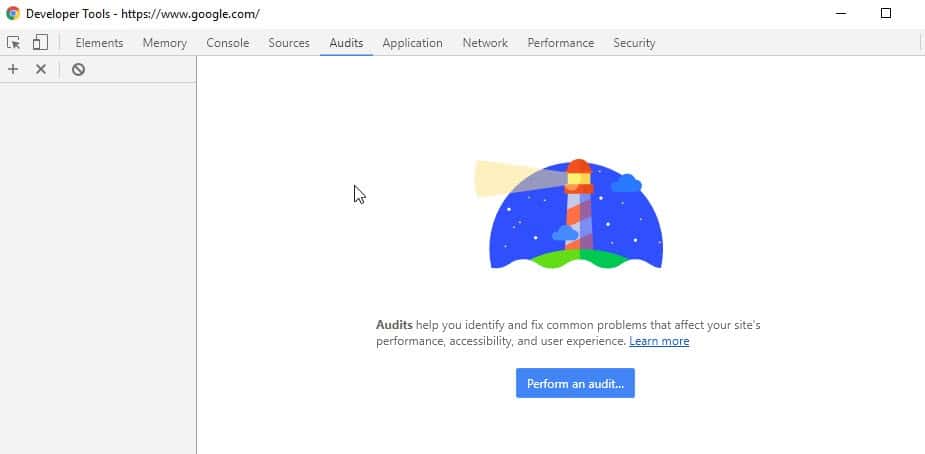
To use Lighthouse is simple. If you are using Chrome 60 or above, you can right click on a page and select Inspect Element. Then click on the Audits tab and you will be able to perform an audit on the page with Lighthouse.
If you are not using Chrome 60 yet, you can download the Lighthouse extension from the Chrome App Store here.
Hopefully now you can see why PageSpeed is a meaningless metric and is not long for the development world. Like everything else about development, times change, the tools change, and better practices come into play. If you have questions or comments we would love to hear them, just comment below, let us know what you think.

PageSpeed is less meaningful to users but not to Google or businesses. From my understanding PageSpeed helps to optimize your site as it pertains to their SEO (and as a by product, UX and front page exposure). From a user perspective, I totally agree, it’s less meaningful in creating a great UX.
Lighthouse seems like a great tool to add to my box, thanks for sharing this!
From my own opinion I think PageSpeed has to be sandbagged in the Google system. Running Analytics, Adsense, and Adwords tracking will kill your score. Does that mean Google penalizes everyone that uses their products? I cannot see that being the case.
There are errors in your article in terms of understanding what “render blocking” really is.
“The initial view of the site could be loaded in the first 100 lines of the CSS file, and paint almost instantly, but PageSpeed would still ding your score if the file was too big.”
This is incorrect. What render blocking means is that an external resource (either your site CSS or JavaScript or what have you) must be loaded before the above the fold content can be rendered. Where in the CSS file the definitions appear, or how large the CSS file is isn’t the relevant issue here:
https://nystudio107.com/blog/implementing-critical-css
And yes, this does make a huge difference in terms of real and perceived performance. I use Lighthouse, GPSI, and a number of other metrics in my tests:
https://nystudio107.com/blog/a-pretty-website-isnt-enough
Actually it is. Play around with the tests. You can get around and fool the PageSpeed tests pretty easily. They are set to work off of size of files, that is it. With http/2 multiple connections do not become an issue. A simple test to work this out is to use a huge CSS library on a test site. Like say include foundation and bootstrap at the same time on a test page. If you include them through a link, like most CSS is included, you will get a ding. If you append them to the head of the page in just a style tag, there is no ding. Even though you are still loading 600kb of CSS that has to be parsed and the screen is repainted several times. Run the same two test sites through Lighthouse and you will get something very different.
No, it really isn’t. Did you read the article I linked to? The basic ideal of the PRPL pattern (https://developers.google.com/web/fundamentals/performance/prpl-pattern/) is that we want to render the above the fold content in a single http response.
That means the browser should be able to render the “above the fold” content without any additional http requests. Which means that all of the CSS needed for the above the fold content needs to be either inlined in the CSS, or server-pushed via http/2 with a very high priority.
“Render blocking” simply means that if the browser has to wait for additional resources, the rendering is blocked. It is not set to work off of “file size”, Google actually instantiates a headless browser, and simulates loading the page, noting when it can’t render the above the fold content without additional resources being loaded.
Don’t believe me? Read Google’s actual explanations yourself for render blocking resources:
https://developers.google.com/speed/docs/insights/OptimizeCSSDelivery
https://developers.google.com/speed/docs/insights/BlockingJS
Your comment about http/2 and multiple connections doesn’t really make sense in this context. Yes, http/2 lets you have multiple _streams_ that go out over a single tcp connection, but you still have only one pipe they all go through. It doesn’t magically give you additional bandwidth, it just relieves some of the antiquated architecture of http1.1
What you’re seeing with Lighthouse is that it is testing many more things in addition to what PageSpeed tests. My concern is the fundamental misunderstanding of what Google PageSpeed tests, and the underlying technologies. It is not as described in the article.
No, actually with http/2 the negotiation is streamed. I get what you are saying about a single request rendering the above the fold content, but its a moot point. Likely any ecommerce site that is not using amp will use a web font. A webfont cannot be rendered in a single http/1.1 request most of the times. Neither can the jquery payload. Neither can the Analytics payload.
This is why developers ushered in http/2. Resources are sent in a stream, they are not magically creating bandwidth, they are channeling multiple resources into streams without renegotiation. This gives the appearance of better bandwidth, without actually creating more, it is just a more efficient usage of current resources.
A great example is the thirty bees demo site against the Shopify demo site. They load in relatively the same time. Even though the thirty bees demo is over 1mb larger. If you look at the response times in the server they are very close to being the same. But because we choose to push http/2 we can send twice as much resources in the same amount of time.
The proper way to do webfonts will be font events (once they become a thing); in the interim, we use FontFaceObserver to simulate them:
https://www.filamentgroup.com/lab/font-events.html
This means that we _don’t need_ to load the webfont to render the above the fold content. Please read up on the PRPL pattern I linked to previously, it describes exactly what I’m discussing here.
We load just what we need to order to render the critical path, and we async load everything else. It doesn’t matter that the webfont doesn’t load in the http response; it doesn’t matter that your JavaScripts don’t load; it doesn’t matter that Google Analytics aren’t loaded in the http response.
We load these resources asynchronously after the initial above the fold content has rendered.
You cannot magically “send twice as much resources in the same amount of time” by utilizing http2’s server push; that’s not how it works.
You wrote a blog that contains a number of misunderstandings and misconceptions; I’m attempting to help you to understand them. I’d really suggest reading up on some of the resources that I’ve linked to, because they contain a ton of information that you’d find useful.
As for the image optimization, optimizing your images is one of the best things you can do for performance. Google dings you for images that can be _losslessly_ compressed better than they are now.
So it isn’t asking you to make images “fuzzier” as the article states, it’s asking you to not make them spuriously lager than they need to be:
https://nystudio107.com/blog/creating-optimized-images-in-craft-cms
That means:
1)_losslessly_ optimizing the images by removing cruft that isn’t needed via jpegoptim/mozjpeg/optipng, etc.
2) Making sure images are sized properly for their display dimensions on the device in question
3) Serving up `webp` images as a progressive enhancement, since they compress better than jpeg/png in most cases, with the same quality
All of this becomes more important as mobile devices dominate the landscape.
Image optimization is a very low bar test that does not mean much to be honest. Using a PHP application? It means you are likely depending on GD like the rest of the world. Which does not compress that well. Looking around the landscape of our competitors, who like every other application, use GD the compression method is not the most important actually. Using SRCSET and other techniques become more important because the change for gain versus the effort to make it happen is lower. That is why I wrote SRCSET handling into the theme. Sure using something like Kraken does help, but is the juice worth the squeeze?
You can use GD, or you can use ImageMagick, both of which are supported by PHP. But you also can very easily run post-optimization using the tools described in the article I linked to (did you read it?)
And yes, it is worth the effort to do, because it doesn’t take very much effort. Images are by far the most weight on modern webpages. If you save 50% on some of the images via lossless compression (not the “fuzziness” described in the article), not only do you make it faster for that one person who loads the page, but also more of the website can be cached on their device.
Then multiply by the number of visitors who hit your site on a daily basis, and it’s pretty clear that you’re going to be saving a whole lot of time and bandwidth in the aggregate.
If you can do something _once_ and it will make a difference hundreds of thousands of times when people request your page, it’s a no-brainer, imo.
As a for-instance, let’s analyze the images on your demo website:
https://webspeedtest.cloudinary.com/results/170812_D6_QS
That page has `1.7mb` of images that could be compressed down to `171kb` of images, or 1/10th the size. That’s 1/10th the bandwidth for the same quality images, which will make a substantive difference in the loading time of your pages (especially on mobile devices), and save yourself and your users a ton of bandwidth in the aggregate.
You have multiple 500kb+ png images that can be losslessly compressed down to 1/4 of the size, or if webp is used, 1/10th of the size. You do this once, everyone who visits your site benefits in perpetuity.
It’s really, really important to know what a test is testing, and why. Not liking a test because you don’t like the results isn’t going to help you, or your web visitors.
At this point I am starting to feel like you have never worked in a mainstream software market. Dive into our php code and see how the images are created. I can point you to exactly where they are, because when I redid the fixtures I needed to make sure it worked.
Yes, we could use imagemagik, or some other post processing system. That is totally viable, in a closed market. What happens when HostGator does not have it installed? Our application fails and a user moves to the next application. Hurray for plugins, that is why we like them. They can rely on things that a mainstream package cannot reliably use.
To be honest, I actually thought about highly optimizing our demo images. I came to the conclusion that it would be disingenuous to do so. It would make our package ship with images that most website hosting companies cannot reproduce. It would have been scammy in my opinion.
We are currently trying to work out a deal with a company to bring webp images to thirty bees though.
It really is a great place to start from( image size reduction that is). Sometimes you may even find speed gains by base64 encodingand in-lining your image, reducing the number of server calls.
Yup, adding a round trip to google and back for their services such as analytics, etc does lower your score as well as your loading times. But there are cunning ways you can self-host analytics files to reduce the number of round trips to google and other servers. Some canny web development invovling page caching (fully or partial) can improve server load times by a great amount also.
tinypng.com is a great way to quickly sort out a lot of larger images btw, I’ve used them for a while and their free service is a godsend.
Finally, as an ecommerce solution, the data is plainly clear in terms of how performance (in terms of page speed) affects conversion. So it would definitely behoove any ecommerce website to consider performance as a feature, to optimize the conversion rate.
Google PageSpeed Insights still factors into pagerank, and given that the mobile index is the source of truth these days, performance should be a priority.
As with any test, we need to fully understand what it is testing to be able to understand the results. A page that performs poorly in GPSI will almost always perform poorly in Lighthouse as well.
https://uploads.disquscdn.com/images/b28779e1af122afc57abdb9e05b332c5ebcb44e5aebc8ee2e1df56ffac2ca5b3.png https://uploads.disquscdn.com/images/b022246d51cbb95b273b625aae58bc3db80d16833cf3c5454b61268476b658c6.png
Google’s Pagespeed metrics have SOME effect on SEO ranking but no one knows to what degree. Their algorithm isn’t in any way public. Actual site load times also have some impact, but it’s a combination of many factors.
Link to this “Lighthouse”, please.
I just updated the post with information on it. The latest version of Chrome has it built in, earlier versions have to download an extension.
Fantastic, thanks!
As prestashop based page owner, I’m devastated. I’ve worked 3 years on a site to optimize it according to page insight metrics, hired developers and customized the crap out of it. Now, I’m being tracked against something else – and I agree with you – this is more reasonable… but for a “small mom&pop online shop”, this is an expensive new metric.
Hiya Sarah. In all honesty, if you’ve already optimized your site to page insight metrics and it’s loading fast, you don’t have to worry about lighthouse stats as a major thing. not many people out there do the progressive web app thing and so far, for me at least, lighthouse seems to return more inconsistent results than other tools such as GTMetrix and googles Test My Site tool linked below.
https://testmysite.withgoogle.com/
If you’re doing well by those two mentioned tools then, chances are, you’re doing well to cover page loading speed issues.
Hope this can put some of that devastation to rest.
The reason that it returns different results is that it tests from your machine at that instance. I do agree that there needs to be a web interface with known locations using it.
Nice when someone speaks your language … been nerding out with lighthouse for the last few days.
Devastation has been put to rest.